Bayesian Modelling for Partitioned Survival CUA
Modelling Framework
we extend the current methods for modelling trial-based partitioned survival cost-utility data, taking advantage of the flexibility of the Bayesian approach, and specify a joint probabilistic model for the health economic outcomes. We propose a general framework that is able to account for the multiple types of complexities affecting individual level data (correlation, missingness, skewness and structural values), while also explicitly modelling the dependence relationships between different types of quality of life and cost components.
Consider a clinical trial in which patient-level information on a set of suitably defined effectiveness and cost variables is collected at $J$ time points on $N$ individuals, who have been allocated to $T$ intervention groups. Assume that the primary endpoint of the trial is OS, while secondary endpoints include PFS, a self-reported health-related quality of life questionnaire (e.g. EQ-5D) and health records on different types of services (e.g. drug frequency and dosage, hospital visits, etc.). Following standard health economic notation, we denote with $\boldsymbol e_{it}$ and $\boldsymbol c_{it}$ the two sets of health economic outcomes (effectiveness and costs) collected for the $i$-th individual in treatment $t$ of the trial. For simplicity, we define $\boldsymbol e_{it}$ and $\boldsymbol c_{it}$ based on the variables used in the analysis.
The effectiveness outcomes are represented by pre-progression ($e^{PFS}_{it}=\text{QAS}^{\text{PFS}}$) and post-progression ($e^{PPS}_{it}=\text{QAS}^{\text{PPS}}$) QAS data calculated using survival and utility data collected up to and beyond progression. We denote the full set of effectiveness variables as $\boldsymbol e_{it}=(e^{\text{PFS}}_{it},e^{\text{PPS}}_{it})$, formed by the pre and post-progression components. The cost outcomes are represented by a set of $K$ variables ($c_{it}=c^k_{it}$, for $k=1,\ldots,K$) calculated based on $K$ different types of health services and associated unit prices. We denote the full set of cost variables as $\boldsymbol c_{it}=(c^1_{it},\ldots,c^K_{it})$, formed by the $K$ different cost components.
The objective of the economic evaluation is to perform a patient-level partitioned survival cost-utility analysis by specifying a joint model $p\boldsymbol e_{it}, \boldsymbol c_{it} \mid \boldsymbol \theta)$, where $\boldsymbol \theta$ denotes the full set of model parameters. Among these parameters, interest is in the marginal mean effectiveness and costs $\boldsymbol \mu=(\mu_{et},\mu_{ct})$ which are used to inform the decision-making process. Different approaches can be used to specify $p\boldsymbol e_{it}, \boldsymbol c_{it} \mid \boldsymbol \theta)$. Here, we express the joint distribution as
\[ p(\boldsymbol e_{it}, \boldsymbol c_{it} \mid \boldsymbol \theta) = p(\boldsymbol e_{it} \mid \boldsymbol \theta_e)p(\boldsymbol c_{it} \mid \boldsymbol e_{it} , \boldsymbol \theta_c), \]
where $p(\boldsymbol e_{it} \mid \boldsymbol \theta_e)$ is the marginal distribution of the effectiveness and $p(\boldsymbol c_{it} \mid \boldsymbol e_{it} \boldsymbol \theta_c)$ is the conditional distribution of the costs given the effectiveness, respectively indexed by $\boldsymbol \theta_e$ and $\boldsymbol \theta_c$, with $\boldsymbol \theta=(\boldsymbol \theta_e,\boldsymbol \theta_c)$. We specify the model in terms of a marginal distribution for the effectiveness and a conditional distribution for the costs. A key advantage of using a conditional factorisation, compared to a multivariate marginal approach, is that univariate models for each variable can be flexibly specified to tackle the idiosyncrasies of the data (e.g. non-normality ans spikes) while also capturing the potential correlation between the variables. We now describe how the two factors on the right-hand side of the Equation can be specified.
The Figure provides a visual representation of the proposed modelling framework.
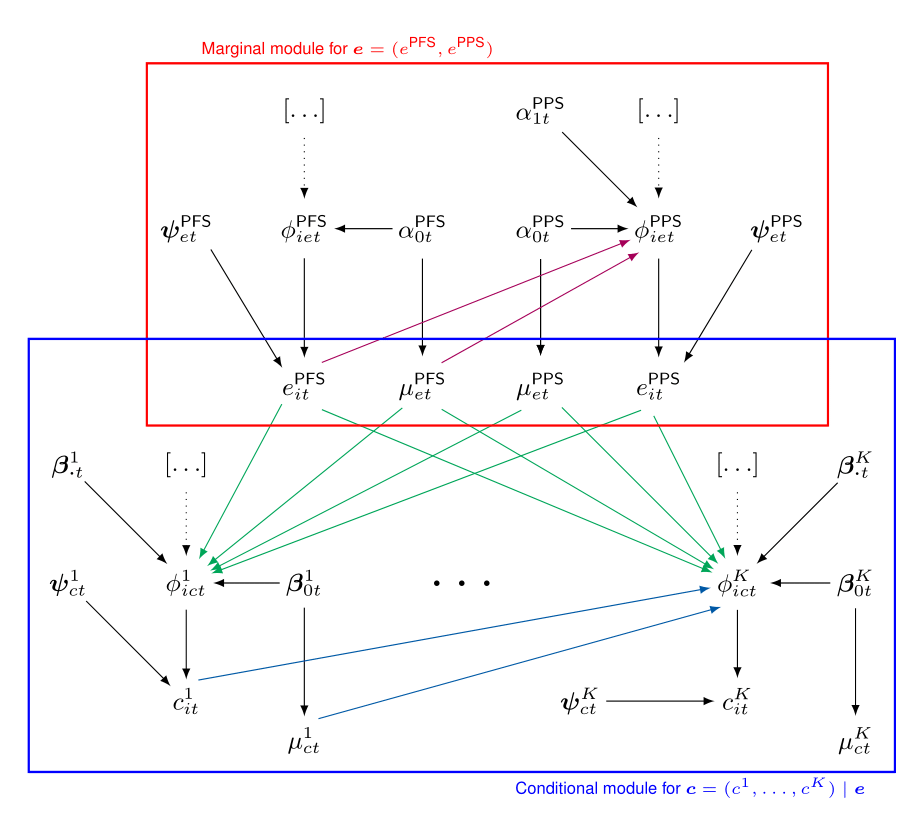
The effectiveness and cost distributions are represented in terms of combined “modules”- the red and blue boxes - in which the random quantities are linked through logical relationships. Notably, this is general enough to be extended to any suitable distributional assumption, as well as to handle covariates in each module.
Conclusions
Although our approach may not be applicable to all cases, the data analysed are very much representative of the “typical” data used in partitioned survival cost-utility analysis alongside clinical trials. Thus, it is highly likely that the same features apply to other real cases. This is a very important, if somewhat overlooked problem, as methods that do not take into account the complexities affecting patient-level data, while being easier to implement and well established among practitioners, may ultimately mislead cost-effectiveness conclusions and bias the decision-making process.